
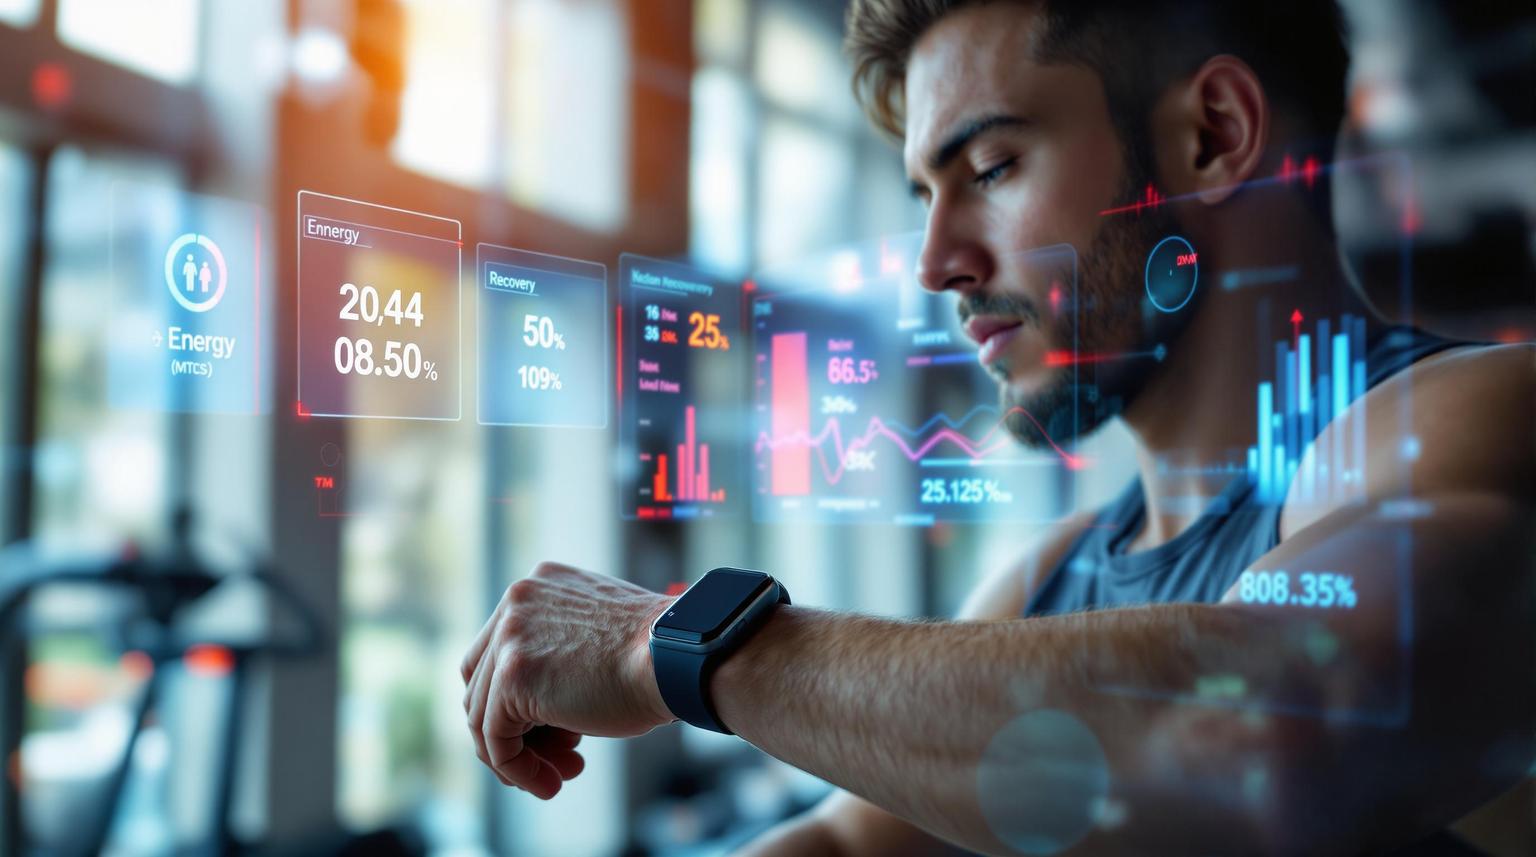
Wearable devices like fitness trackers and smartwatches are transforming how we monitor energy use and recovery. They provide real-time insights into your body’s performance, helping you train smarter and recover better. Here’s what they track:
- Heart Rate Variability (HRV): Measures stress and recovery readiness.
- Sleep Stages: Tracks deep sleep and REM for recovery insights.
- Calories Burned: Calculates daily energy expenditure in kilocalories (kcal).
- Resting Heart Rate: Reflects cardiovascular health.
- Training Load: Monitors exercise intensity over time.
These devices use advanced sensors (like PPG and accelerometers) and algorithms to process data and provide actionable feedback. By syncing with apps, they give you a complete view of your health and fitness, helping you adjust workouts, prevent injuries, and optimize recovery.
| Metric | Purpose | Examples |
|---|---|---|
| Heart Rate Variability | Recovery & stress monitoring | Apple Watch, Fitbit Sense 2 |
| Sleep Tracking | Recovery potential | Deep/REM stages |
| Daily Energy Use | Calories burned (kcal) | Workouts & daily activity |
| Training Load | Exercise intensity over time | Fitness progress |
Wearables are becoming smarter with AI and better sensors, offering more accurate and personalized insights for fitness and health goals.
Apple Watch Training Load and Recovery Tracking Deep Dive …
Core Wearable Technology
Modern wearables combine hardware and software to monitor energy use and recovery. Together, these systems provide users with insights into their physical condition.
Key Sensors
Wearable devices rely on various sensors to track physiological data. Some of the most common include:
- Photoplethysmography (PPG) Sensors: Use light to measure heart rate and blood oxygen levels.
- Accelerometers: Measure movement and count steps.
- Gyroscopes: Detect orientation changes and help identify specific activities.
- Temperature Sensors: Track skin temperature to provide recovery insights.
- Bioimpedance Sensors: Assess body composition and hydration.
These sensors work continuously throughout the day to provide detailed monitoring.
Data Processing Systems
The raw data collected by sensors goes through multiple steps to become meaningful metrics. This process includes:
- Signal Processing: Removes noise and motion-related distortions.
- Machine Learning Algorithms: Turns raw data into recognizable patterns of activity.
- Neural Networks: Analyze sleep cycles and recovery details.
- Fusion Algorithms: Combine inputs from different sensors for better accuracy.
Many wearables have built-in processors to handle this data, offering real-time feedback without needing constant smartphone connectivity.
Data Sync Methods
Wearable devices use various technologies to transfer data for further analysis and display. Here’s a quick comparison of the main methods:
| Sync Method | Transfer Speed | Power Usage | Range |
|---|---|---|---|
| Bluetooth LE | Up to 2 Mbps | Very Low | 30–60 ft |
| Wi-Fi Direct | Up to 250 Mbps | Medium | 150–200 ft |
| NFC | 424 Kbps | Minimal | 4 inches |
These options allow easy integration with apps and platforms. For example, the "Fit For Golf" app works seamlessly with the Apple Watch, enabling real-time synchronization during workouts. Data transfers happen automatically, ensuring dashboards are updated promptly.
Dashboard Integration Steps
Collecting Data
Securely gather wearable data using APIs that connect to devices like Apple Watch and Fitbit through their SDKs. Developers use tools such as:
- OAuth: Ensures secure user authorization.
- WebSocket connections: Allows real-time data streaming.
- Data validation routines: Verifies the accuracy of incoming metrics.
- Local caching: Keeps data accessible during connectivity issues.
This data serves as the backbone for further analysis and insights.
Developing Analysis Tools
Turn raw data into meaningful insights with an efficient processing pipeline. Statistical tools and visualizations help translate sensor data and real-time metrics into easy-to-understand formats. Custom algorithms can then use this information to calculate personalized metrics, like recovery scores.
For example, the Fit For Golf app (launched in 2023 by 2V Modules) uses Apple Watch data to monitor swing speed and workout stats, offering users tailored training advice.
Designing Dashboards
Once the data is processed, the final step is creating dashboards that present the information clearly. Here’s an example of how metrics can be displayed:
| Metric Type | Display Format | Update Frequency | User Interaction |
|---|---|---|---|
| Energy Level | Gauge Chart | Real-time | Tap for details |
| Recovery Status | Progress Bar | Every 4 hours | Swipe for history |
| Training Load | Line Graph | Daily | Pinch to zoom |
| Sleep Quality | Heat Map | Daily | Tap for breakdown |
Key design tips:
- Highlight important metrics for quick reference.
- Ensure dashboards are responsive and easy to navigate.
- Focus on performance to minimize load times.
Common Tracking Issues
Measurement Accuracy
Advanced sensors can provide detailed metrics, but they’re not immune to errors. Poor sensor placement or interference can lead to inaccuracies. For instance, a loose sensor during a tough workout might throw off heart rate readings, while intense arm movements can mess with calorie estimates. Even nearby electronics can disrupt sensor performance.
Algorithm Limitations
Beyond sensor problems, the algorithms that process the data can also fall short. These algorithms often aim to balance real-time processing with battery life, which can lead to oversimplified results. For example, smoothing out complex data patterns might make metrics less precise. Recovery metrics, in particular, are usually updated periodically, not in real-time, which can affect their usefulness.
Personal Differences
Individual factors like body composition, fitness level, age, and gender also influence tracking accuracy. These differences make it tricky to calculate metrics like energy use and recovery rates. Some devices, like the Apple Watch, now include personalization features to address this challenge. Wearing your device consistently, calibrating it regularly, and focusing on trends over time can help you get better insights.
Next Steps in Wearable Tech
AI Customization
Artificial intelligence is transforming wearables by learning from your workouts, sleep patterns, and daily routines. It uses this data to provide real-time feedback on energy use and recovery, tailored to your fitness level, age, and training history. This opens the door to even more advanced sensor technology.
Sensor Advances
New sensor technology is making wearables more precise and user-friendly. Multi-wavelength optical sensors now deliver better measurements of blood oxygen levels and heart rate variability. Smaller sensors make wearables less intrusive, while bioelectrical impedance sensors track hydration and muscle fatigue in real time. These improvements make it easier to connect wearables seamlessly with other health tools.
Connected Health Systems
Wearables now integrate their data into detailed fitness dashboards, offering a clear picture of your health and progress. These connected systems sync across multiple devices, analyzing patterns in your activities, workouts, and recovery. This allows users to fine-tune their training plans for improved outcomes.
Summary
Wearable technology is changing how we track energy use and recovery by using advanced sensors and efficient data processing. The result? Dashboards that turn raw data into actionable insights.
A great example is Fit For Golf LLC’s 2023 project. They worked with 2V Modules to create a custom solution that combined the Apple Watch with Google Calendar for workout tracking. This setup highlights how tailored dashboards can improve user experience and make data more useful.
Key developments in wearable tech include:
- AI Integration: Providing tailored analysis of workouts and recovery.
- Improved Sensors: Offering more accurate data and better insights.
These advancements aim to deliver even more precise and useful information to users. By using APIs from major platforms, designing user-friendly dashboards, and ensuring compatibility across devices, brands can create seamless experiences.
Custom dashboards play a critical role in turning wearable data into effective tools for health and fitness. As AI becomes more advanced, these systems will keep improving, offering deeper and more personalized insights.